
Legacy in Pictures: How We Drew PNG Diagrams on the Backend
· 3 min read
Configuring the file structure via sidebar.toml was only half the battle. The second strict requirement for a successful migration at work was the presence of visual Class Hierarchy diagrams.
The problem was that the old generator output these diagrams not as a trendy interactive web component, but as ordinary, static PNG images embedded directly into the HTML code.
Why Not Modern JS?
In the modern world, the logical solution would be to pass a JSON tree structure to the frontend and render a beautiful interactive graph using Mermaid.js or React Flow.
But we had strict limitations. The generated documentation had to be able to work offline, load instantly without heavy JS bundles, and most importantly, visually match the old corporate style. There was only one solution left: draw real PNG files right during the build process on the backend.
Pixel Art with Pillow

We brought the Pillow library into the pipeline.
Generating graphics on the server side is quite a quest. We had to write AST traversal logic that took a class’s list of ancestors and programmatically drew them on a virtual canvas. We manually calculated font sizes, the coordinates of each rectangle, margins, and drew connecting lines with arrows. It was painstaking work with graphic primitives inside a harsh documentation generation engine.
Regression Testing Hell
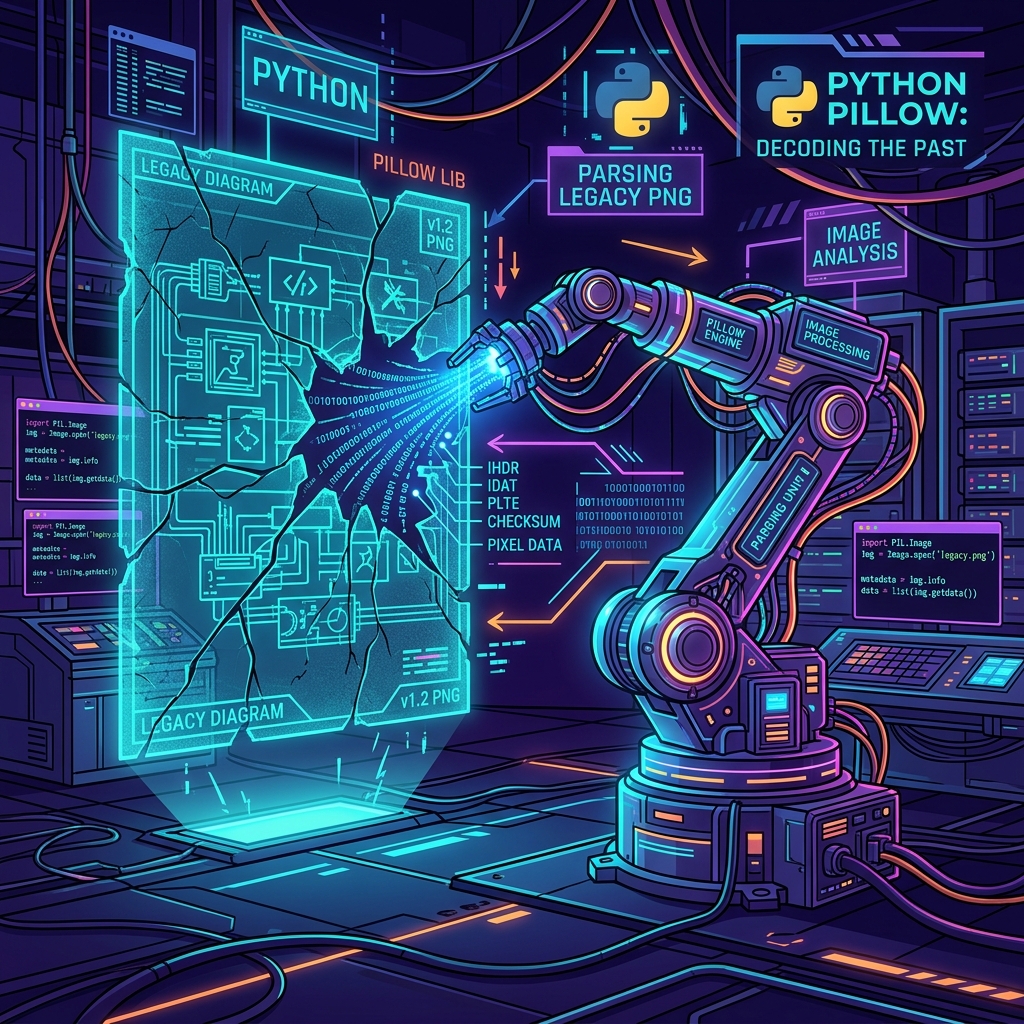
The real fun began when we covered this functionality with regression tests. In our CI pipeline, the image tests started failing unpredictably.
Initially, we compared the generated PNG files with reference images byte-for-byte (raw bytes). But an unpleasant detail emerged: the PNG compression byte stream differed slightly depending on the operating system (Windows on a local machine vs Linux in CI). Different versions of the system zlib library compressed the exact same pixels into different binary code.
Visually, the images were absolutely identical, but the file hashes diverged. We had to completely rewrite the tests: now we loaded both the reference and the result through Pillow, decoded them, and compared the RGBA matrices in memory pixel by pixel. Only then did the tests turn green.
Moving to the Core
Just like with sidebar.toml, we initially wrote the image generation exclusively as a crutch for the working plugin.
But when the algorithm was debugged, we realized we had built a cool feature. Lightweight, static inheritance diagrams without JS dependencies are an objective plus for any project. Following the established pattern, we pulled the graphics rendering logic out of the closed plugin and moved it into the main Flude core.
Conclusion
All work requirements were met: both for links and for images. The core proved its flexibility and readiness to operate in harsh Enterprise conditions.
Ahead of us lay stepping outside our cozy local environment. It was time to integrate our CLI clients with popular CI/CD platforms. How we lost environment variables in GitLab and battled proxies in Bitbucket—read about it in the next episode.